
Another good challenge from LetsDefend.io and kudos to this challenge creator, 0xCyberJunkie.sh. You can access the challenge through this link.
I intentionally masked part of the answers so you will have to do the necessary steps to see the entirety of the the answers.
Scenario: A Windows endpoint was recently compromised. Thanks to the cutting-edge EDR/IDS solution we immediately noticed it. The alert was escalated to Tier 2 (IR Team) for further investigation. As the forensics guy, you were given the memory dump of the compromised host. You should continue to investigate.
Tools: Volatility2, Volatility3, CrackStation, and PEStudio
Questions:
- What was the date and time when the memory from the compromised endpoint was acquired?
- {2022-**-** **:**:**}
- Type the command: ./vol.py -f location_of_the_dumped_memory_file windows.info
- -f – this argument is to define the file location.
- windows.info – to show OS and kernel details of the memory sample being analyzed.
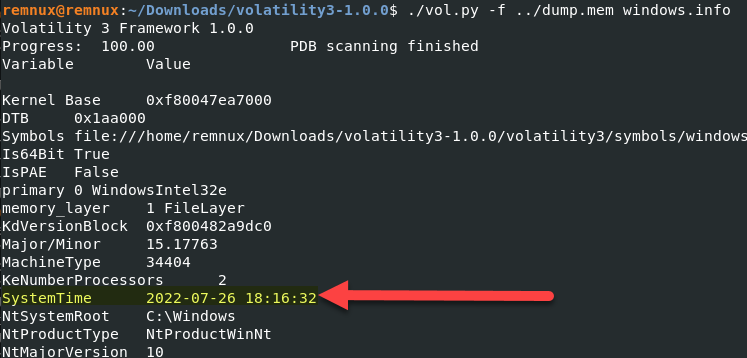
- {2022-**-** **:**:**}
- What was the suspicious process running on the system?
- {l****.**e}
- Type the command: ./vol.py -f location_of_the_dumped_memory_file windows.pstree
- windows.pstree – is the plugin for listing processes in a tree format based on their parent process ID.
- You will see on the image below, there are two lsass.exe processes. The top one has a parent PID of 500 which is a legitimate parent process for lsass.exe. The second entry is showing Explorer.exe as its parent PID, which makes it suspicious.
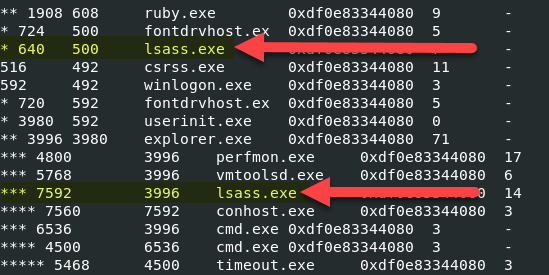
- {l****.**e}
- Analyze and find the malicious tool running on the system by the attacker.
- {w******.**e}
- In question number two, we were able to identify the malicious process.
- Using Volatility 2, type the command: volatility -f location_of_the_dumped_memory_file –profile=Win10x64_17134 procdump -D dump/ -p 7592
- procdump – is the plugin to dump a process to an executable file sample
- -D – is the argument to point the location where to dump the process
- -p – is the process ID that we want to dump

- As you can see above we now have a file called executable.7592.exe
- And when you do file dumpo/executable.7592.exe, the result shows that this is a PE file.

- Open up PEStudio, and load executable.7592.exe, we will see what is the tool name.
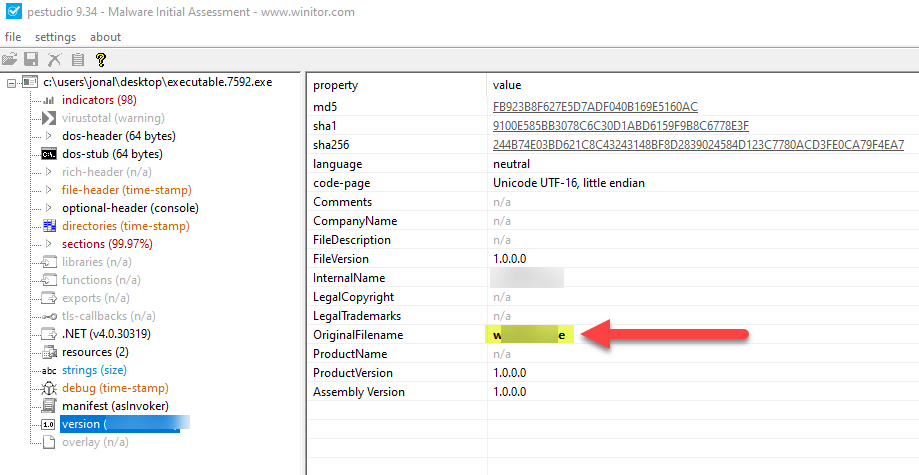
- {w******.**e}
- Which User Account was compromised?
- {m**********/**********e}
- Type the command: ./vol.py -f location_of_the_dumped_memory_file windows.envars
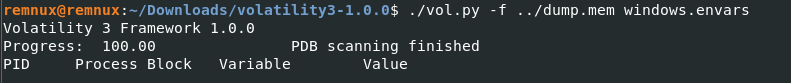
- windows.envars – is to display process environment variables
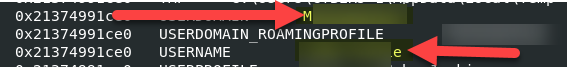
- Type the command: ./vol.py -f location_of_the_dumped_memory_file windows.envars
- {m**********/**********e}
- What is the compromised user password?
- {p*********3}
- First we will need to do a hash dump to retrieve the password hashes.
- Type the command: ./vol.py -f location_of_the_dumped_memory_file windows.hashdump
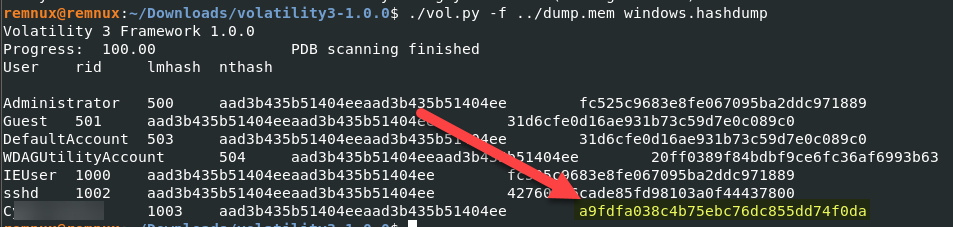
- Open CrackStation through your choice of browser and enter the NT hash that you retrieved.
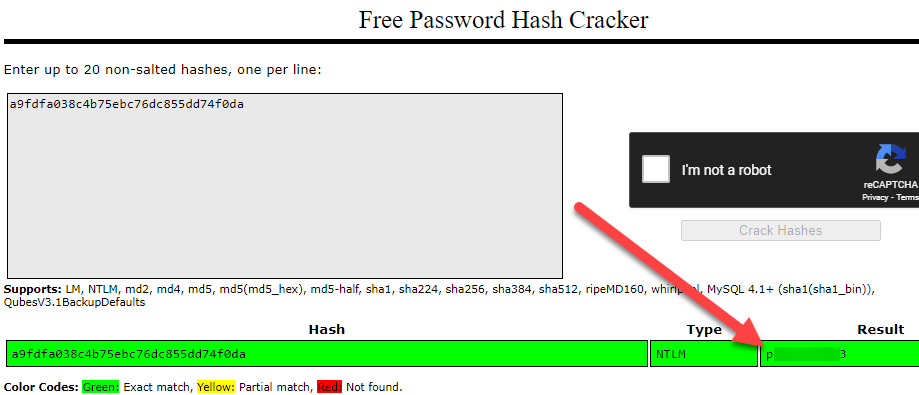
- {p*********3}
I hope you enjoyed this short challenge.
Please subscribe to my blog if you haven’t done so.

Thank you! This will help so much with the challenge.
LikeLike
Haha, you crack me up!
LikeLike